Data profile¶
Generated by docs/generate_plots.py from the actual built cohort — make
docs-assets regenerates these charts and CI fails if the committed files
drift from what it produces (PORTFOLIO_PLAN_V3.md §9.4).
The cohort is Synthea
(Apache-2.0, MITRE Corporation) synthetic patients, Massachusetts, seed and
population size committed in data/synthea.config.json. Every date has
been shifted per-patient before this cohort was built — see
data/deidentify.py and D-A12-2 in decisions.
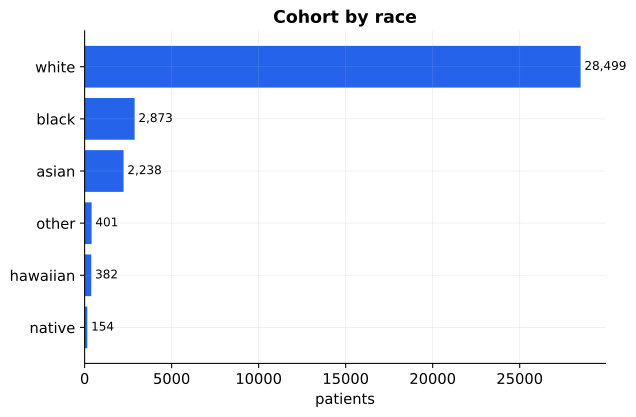
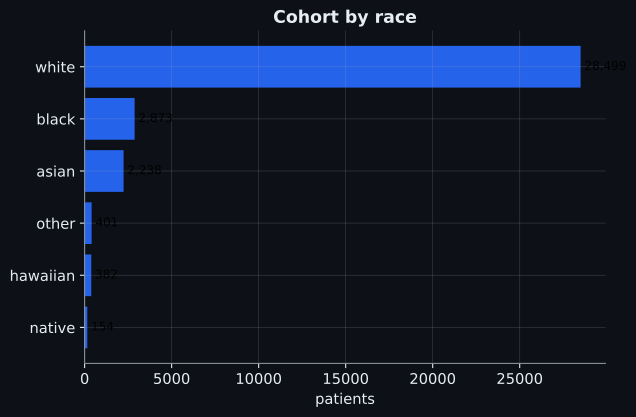
Race¶
Age¶
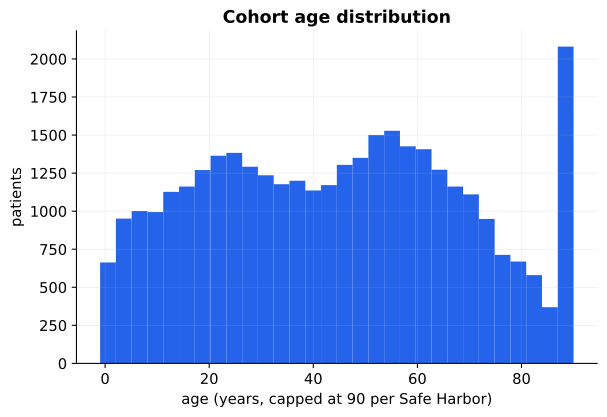
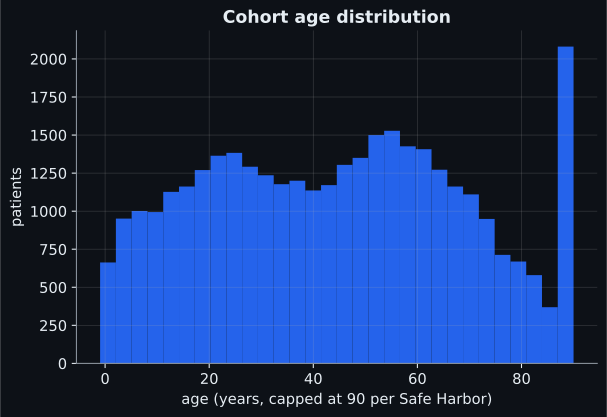
Ages above 89 are capped at 90 per HIPAA Safe Harbor before this chart is
drawn — see data/deidentify.py.
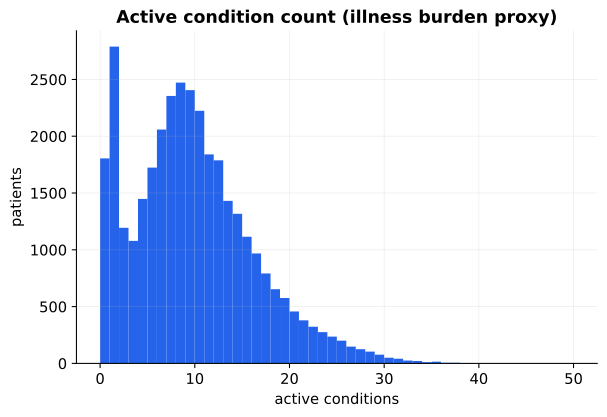
Illness burden proxy¶
Active condition count is the illness-burden signal pipeline/labels/burden_label.py
builds on (Phase 4) — deliberately never touched by the access-gap injection
described below.
Disclosure: the injected access gap¶
Synthea generates realised cost from utilisation with no differential
access by race, so this cohort's utilisation and spend fields have been
deliberately adjusted for one stratum, at equal illness burden, per the
seeded and committed data/access_gap.config.json. This is what makes the
label-choice experiment (Phase 4) demonstrate the Obermeyer et al. (Science,
2019) failure mode rather than merely claim to. See D-A12-2.