Data profile
Every chart on this page is generated by make docs-assets, and regenerating it
produces byte-identical output — so a chart cannot quietly drift from the
data it describes.
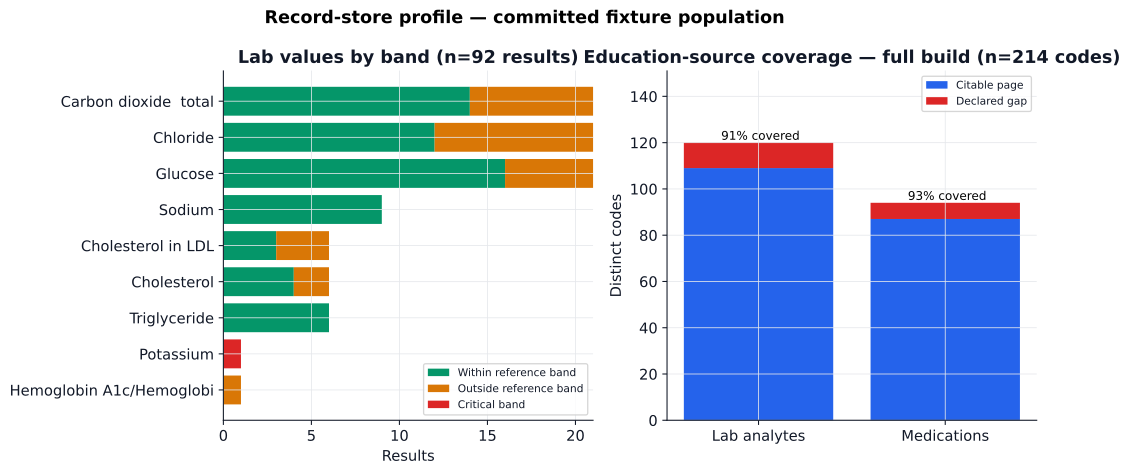
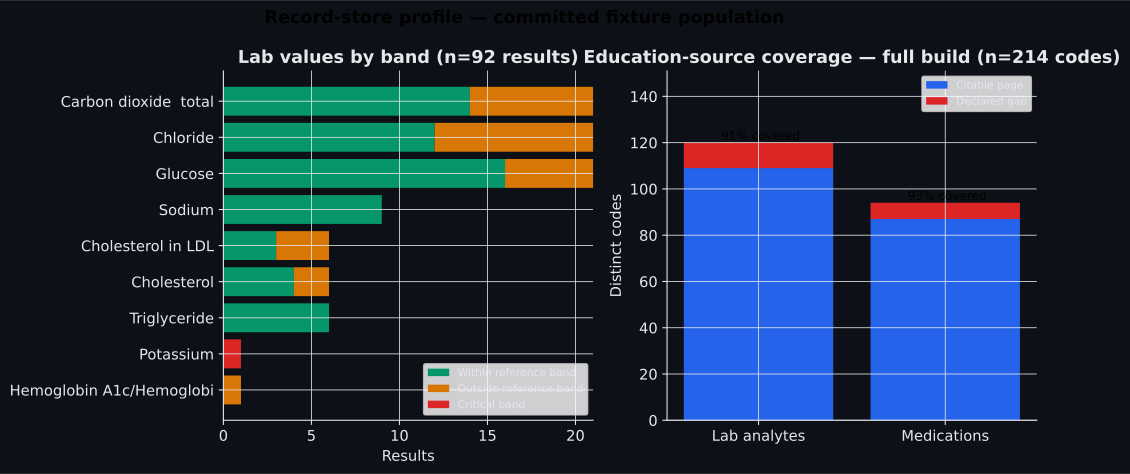
What each panel is for
Left — lab values by band. This is what the post-flight critical-value check compares against, made visible. It also answers a question a sceptical reader should ask: a population of uniformly normal values would make any guardrail look good, because nothing in it ever needed to escalate.
Right — education-source coverage. Which LOINC codes and RxCUIs in the generated population resolved to a real MedlinePlus page, and which did not. This is the honest panel. Some analytes and medications have no vetted public page, and the assistant declares that gap rather than filling it. Showing the size of the gap up front is better than discovering it one question at a time.
The two populations, and why they differ
The panels carry different sample sizes on purpose:
| Panel | Population | Why |
|---|---|---|
| Lab values by band | The committed fixture population | The full Synthea population is rebuilt by make data and deliberately not committed (see data pipeline), so a chart drawn from it could not be regenerated in CI |
| Education coverage | The full build | Coverage is a property of the education pipeline, not of two patients. The build's numbers are committed with the fixture — never its content |
Both figures state their own n on the chart. That is the same discipline the evaluation metrics follow, applied to a data chart: a number without its sample size invites a reader to assume a larger one.
Current figures
From the most recent data build:
| Measure | Value |
|---|---|
| Lab analytes requested | 120 |
| Lab analytes with a citable page | 109 (91%) |
| Medications requested | 94 |
| Medications with a citable page | 87 (93%) |
| Medications resolved via RxNav ingredient normalisation | 6 |
| Distinct citation URLs | 149 |
| Citation URLs verified reachable | 149 of 149 |
| Declared coverage gaps | 18 |
The 18 gaps are not a defect to be closed by writing content. They are codes for which NLM publishes no patient-facing page, and the correct behaviour for those is canonical case 14: say so, and route.
One planted value, declared
Synthea generates plausible physiology, so nobody in the population has a critical potassium — which would leave canonical case 4, the case that proves the post-flight half of the guardrail is real, with nothing to fire on. One observation is therefore injected: potassium 6.9 mmol/L, above the cited critical threshold.
It is recorded in a scenario_fixtures table rather than slipped into the
population, so it can be found, counted and excluded. A demonstration that
depends on a planted value is fine. One that hides it is not.